Meal Planning Statistics 2026: 30+ Verified Data Points
Meal planning statistics tell a compelling story: households that plan meals spend less on groceries, waste less food, eat healthier diets, and reclaim hours of decision-making time every week. With the diet and nutrition apps market worth $5.76 billion and AI-driven personalization accelerating adoption, 2026 marks a turning point in how people approach food at home. This article compiles 30+ data points from government agencies, peer-reviewed research, and industry reports to quantify exactly what meal planning delivers — and what it costs when you skip it.
Key Takeaways
- Diet & nutrition apps market worth $5.76B in 2025, growing at 11.97% CAGR (Mordor Intelligence)
- U.S. families of four waste nearly $3,000/year on uneaten food (EPA)
- Americans spend 40 minutes/day on food prep; 63% cook on any given day (BLS)
- 57% of adults plan meals at least occasionally (n=40,554 study, PMC)
- Meal planning associated with better diet quality and lower obesity rates
- Consumer food waste = 50% of all U.S. surplus food, costing $259B/year (ReFED)
Table of Contents
→ The Meal Planning Market in 2026
→ Who Plans Their Meals? Adoption Rates
→ How Meal Planning Saves Money
→ How Meal Planning Saves Time
→ Meal Planning and Health Benefits
→ Food Waste — The Hidden Cost
→ Home Cooking vs. Eating Out
→ The Rise of AI in Meal Planning
→ Frequently Asked Questions
→ Methodology & Sources
The Meal Planning Market in 2026
The meal planning industry has grown from a niche productivity tool into a multi-billion-dollar market segment. Several forces drive this: rising grocery costs, growing health consciousness, food waste awareness, and the integration of AI into consumer applications. Here are the numbers.
The diet and nutrition apps market — which includes meal planners, calorie counters, and macro trackers — is valued at $5.76 billion in 2025 and is forecast to reach $10.15 billion by 2030, growing at an 11.97% CAGR (Mordor Intelligence). Within this market, calorie and macro tracking holds 39.13% of market share, while subscription models generate 44.89% of total revenue.
AI-driven features are the fastest-growing segment. AI-powered portion sizing and meal planning is expanding at 13.89% CAGR through 2030 (Mordor Intelligence). Leading platforms are adding AI meal planning, medication-aware nutrition programs, and multi-modal sensor integration as differentiators.
Geographically, North America captures 32.78% of revenue, while Asia-Pacific is the fastest-growing region at 14.03% CAGR through 2030 (Mordor Intelligence). Android holds 56.34% of market share, reflecting the global dominance of Android in mobile health apps.
| Market Metric | Value | Source |
|---|---|---|
| Diet & Nutrition Apps (2025) | $5.76 billion | Mordor Intelligence |
| Projected (2030) | $10.15 billion | Mordor Intelligence |
| CAGR | 11.97% | Mordor Intelligence |
| AI Meal Planning CAGR | 13.89% | Mordor Intelligence |
| North America Revenue Share | 32.78% | Mordor Intelligence |
The data is clear: meal planning is transitioning from spreadsheets and Pinterest boards to dedicated software, and AI personalization is the primary growth driver. Apps that combine pantry management, dietary customization, and AI generation are capturing the largest share of new users.
Who Plans Their Meals? Adoption Rates
Meal planning is more common than most people assume, but the depth of planning varies widely. Here is what the research shows about who plans and how they do it.
A large-scale French study from the NutriNet-Santé cohort (n=40,554) found that 57% of adults declare planning their meals at least occasionally (PMC/PubMed, PMID: 28153017). Women were more likely to plan than men, and planning prevalence increased with age.
The IFIC 2023 Food & Health Survey sheds light on why: 91% of respondents saw food price increases in the past year, with 72% noting a “major” increase. 76% cite price as a factor in food purchase decisions (up from 68% in 2022). Rising costs are pushing more consumers toward planning as a savings strategy.
The connection between food stress and planning is direct: 51% of consumers ate less healthy food due to stress in the past six months, and 60% reported being somewhat or very stressed in 2023 (IFIC). Meal planning addresses both problems — it reduces the daily stress of food decisions while keeping nutrition on track.
Home cooking demand remains strong. According to BLS Consumer Expenditure data, Americans spent $6,224 on food at home in 2024 (61.2% of food spending), compared to $3,945 on food away from home (38.8%). The demand is not for less cooking — it is for less planning, less decision-making, and less waste.
How Meal Planning Saves Money
The financial case for meal planning is built on three pillars: reduced food waste, fewer impulse purchases, and fewer restaurant meals. Each one is well-documented.
The EPA reports that the average U.S. family of four spends nearly $3,000 per year on food that goes uneaten. That is roughly $250 per month thrown away — more than most meal planning subscriptions cost in a year. The EPA estimates that reducing food waste could save a family of four $56 per month ($672/year) as a baseline.
Per person, ReFED data shows the average American spent over $760 on wasted food in 2024. Across the country, consumer food waste accounts for nearly 50% of all surplus food at a cost of $259 billion. A third of all consumer surplus comes from uneaten groceries at home.
Unplanned purchases compound the problem. ReFED notes that many consumer purchases are unplanned, leading to overbuying. Families are tempted into bulk deals on food they never consume. A structured shopping list derived from a meal plan directly eliminates most of these impulse purchases.
At the national level, 30–40% of the U.S. food supply goes uneaten (EPA). In 2024, the total value of surplus food reached $381 billion, with $325 billion due to actual waste (ReFED). For the full breakdown, see our Food Waste Statistics 2026 article.
| Metric | Value | Source |
|---|---|---|
| Annual food waste per family of 4 | ~$3,000 | EPA |
| Annual food waste per person | $760+ | ReFED |
| Potential monthly savings per family | $56/month ($672/year) | EPA |
| U.S. consumer food waste total | $259 billion | ReFED |
| U.S. food supply wasted | 30–40% | EPA |
Bottom line: The EPA puts household food waste at nearly $3,000/year for a family of four. Even modest waste reduction through meal planning saves $56/month ($672/year). Pantry-first planning — cooking from what you already have — eliminates the root cause: buying food without a plan.
For budget-focused meal planning strategies, see our budget meal planner guide. Families with children can save even more with a family meal planner that scales portions and handles picky eaters.
Stop Wasting $3,000/Year on Thrown-Away Food
Qedamio builds meal plans from food you already own. Fewer impulse buys, less waste, lower grocery bills.
How Meal Planning Saves Time
Time savings from meal planning are less intuitive than financial savings but equally significant. The hours reclaimed come not from faster cooking but from eliminated decision-making.
According to the BLS American Time Use Survey (2024), Americans spend an average of 0.67 hours per day (40 minutes) on food preparation and cleanup. Women average 52 minutes, men 28 minutes. Over a week, that totals 4.7 hours for the average person — and 7.4 hours for those who actually cook (1.06 hrs/day among the 63.1% who engage in food prep on any given day).
But this BLS figure only captures hands-on prep time. It does not include the invisible time spent deciding what to cook, checking what ingredients are available, making mid-week grocery runs, or the mental overhead of tracking what everyone in the household will and will not eat. A meal plan eliminates this decision layer entirely — the meal is already decided, the ingredients are already on hand.
63.1% of the population engages in food prep and cleanup on an average day (BLS ATUS 2024). Women are more likely to cook (71.6%) than men (54.2%), and people are slightly more likely to cook on weekdays (64%) than weekend days (62%).
AI meal planners compress the planning step even further. Traditional meal planning — browsing recipes, cross-referencing pantry inventory, building a shopping list — takes 60–90 minutes per week. An AI meal planner like Qedamio reduces this to 1–2 minutes: the user's pantry is already inventoried, dietary preferences are stored as Food Rules, and macro targets are pre-set. One tap generates a complete multi-day plan with an aggregated shopping list. The 60-minute weekly task becomes a 60-second weekly task.
Meal Planning and Health Benefits
The health benefits of meal planning have been studied in large-scale cohort research, not just anecdotal reports. The evidence consistently shows that people who plan meals eat better and weigh less.
The most cited study comes from the French NutriNet-Santé cohort (n=40,554): meal planners have significantly better dietary quality and greater food variety than non-planners (PMC, PMID: 28153017). The study measured diet quality using the Programme National Nutrition Santé Guidelines Score (PNNS-GS) and found a clear, statistically significant association between meal planning and higher scores.
The same study found that women who plan meals are less likely to be overweight or obese (PMC, PMID: 28153017). While the study design (cross-sectional) cannot prove causation, the association held after controlling for socioeconomic factors, age, and physical activity level. The mechanism is likely reduced reliance on convenience foods and takeout, which are typically higher in calories, sodium, and added sugars.
Home cooking time directly correlates with nutrition quality. Research from the University of Iowa and Community Health Collaborative found that more time spent cooking at home is associated with significantly higher fruit and vegetable intake (Community Health Collaborative). Meal planning enables more home cooking by removing the primary barrier — deciding what to cook.
Digital platforms are showing clinical results. Digital meal planning platforms show sustained weight loss in obese users in controlled studies (JMIR — Journal of Medical Internet Research). The key differentiator from traditional diets is adherence: when the planning friction is removed, users stick with the program longer.
Key finding: A study of 40,554 adults found that meal planners have better dietary quality, greater food variety, and lower obesity risk. The evidence is strongest for women, where meal planning was independently associated with lower likelihood of being overweight or obese after controlling for age, income, and physical activity.
The IFIC 2023 survey confirms that 74% of consumers believe foods and beverages have a significant or moderate impact on overall well-being. Meal planning apps that calculate portions and macros automatically — rather than requiring manual logging — align with this health consciousness. For a detailed look at macro-based meal planning, see our macro calculation guide and high-protein foods reference.
Food Waste — The Hidden Cost
Food waste is the least visible cost of poor meal planning — and the largest. The numbers at global, national, and household levels all point to the same conclusion: households are the primary source of food waste, and planning is the most effective intervention.
In the U.S., 30 to 40 percent of the food supply is never eaten (EPA). Food waste is the single most common material landfilled and incinerated in the country — not plastic, not paper, but food.
In 2024, the total value of surplus food in the U.S. reached $381 billion. Of this, 85% — $325 billion — was due to food waste (ReFED). That is almost 114 billion meals’ worth of food going unsold or uneaten each year.
Consumer food waste accounts for nearly 50% of all surplus food at a cost of $259 billion (ReFED). Contrary to popular belief, the largest source is not restaurants, grocery stores, or farms — it is individual households. Nearly three-quarters of consumers report they waste less than average (ReFED), revealing a major perception gap.
Date label confusion makes the problem worse. Misunderstanding “best by,” “sell by,” and “use by” dates leads consumers to throw away food that is still safe to eat (ReFED). Unplanned purchases and bulk-buying deals further compound waste.
The waste is concentrated in perishables. Over 80% of surplus food comes from perishable items, with fruits and vegetables alone making up more than a third of all food waste (ReFED). These are exactly the foods that meal planning most effectively prevents from going to waste.
In the EU, food waste totaled 58 million tonnes in 2023, with households accounting for 31 million tonnes (53%). Per capita, the EU generates 130 kg of food waste per person per year (Eurostat).
Meal planning addresses food waste through three mechanisms: using existing inventory before buying new items (pantry-first planning), buying only what the plan requires (structured shopping lists), and scheduling meals so perishable items are used first. For the full picture on food waste numbers, see our dedicated Food Waste Statistics 2026 article with 40+ verified data points. For a practical guide on reducing food waste through planning, see our food waste reduction guide. A pantry-based meal planner maximizes waste reduction by building every plan from food you already have on hand.
Home Cooking vs. Eating Out
The economics of home cooking versus eating out have shifted dramatically in recent years. Americans are spending more on restaurants than ever before, and the cost gap between home-cooked and restaurant meals continues to widen.
The BLS Consumer Expenditure Survey (2024) provides the definitive breakdown. The average American household spent $10,169 on food in 2024 — $6,224 on food at home (61.2%) and $3,945 on food away from home (38.8%). Food represents 12.9% of total household expenditures.
The detailed 2023 BLS report reveals where restaurant spending goes: fast food accounted for $1,727/year (up 17.3% from 2022), while full-service restaurants totaled $1,485/year. Fast food spending is growing faster than any other food category.
The trend over time shows food-away-from-home spending gradually rising as a share of the total:
| Year | Food at Home | Food Away | Away % |
|---|---|---|---|
| 2019 | $4,643 | $3,526 | 43.2% |
| 2020 | $4,935 | $2,375 | 32.5% |
| 2021 | $5,259 | $3,030 | 36.6% |
| 2022 | $5,703 | $3,639 | 39.0% |
| 2023 | $6,053 | $3,933 | 39.4% |
| 2024 | $6,224 | $3,945 | 38.8% |
The COVID-19 dip in 2020 (32.5% away) shows what happens when people are forced to cook at home. Spending has rebounded since, but home cooking still commands the majority at 61.2%. The barrier is not willingness — it is the planning effort.
Overall, about 20% of meals are eaten out across the general population, rising to 26% for Gen Z (Escoffier). Younger consumers eat out more frequently, making them a key demographic for meal planning tools that make home cooking feel as effortless as ordering delivery.
Meal planning directly shifts the balance by removing the planning friction that drives people to restaurants and delivery apps. When dinner is already decided and the ingredients are already in the fridge, the default shifts from "order something" to "cook the plan." For goal-specific plans, see our guides for weight loss meal planning and muscle building nutrition.
The Rise of AI in Meal Planning
Artificial intelligence is reshaping the meal planning market faster than any other technology trend in the food industry. For the full breakdown of AI in nutrition, see our dedicated AI in Food & Nutrition Statistics 2026 article. The growth rates, adoption figures, and user behavior data all point in the same direction: AI is becoming the default way people plan meals.
The broader diet and nutrition apps market is valued at $5.76 billion in 2025, projected to reach $10.15 billion by 2030 at an 11.97% CAGR (Mordor Intelligence). Within this market, AI-powered portion sizing and meal planning is expanding at 13.89% CAGR — outpacing the overall market and capturing a growing share of new users.
Leading platforms are integrating AI meal planning, medication-aware nutrition programs, and multi-modal sensor data. Subscriptions generate 44.89% of total revenue in the diet and nutrition apps space, with North America capturing 32.78% of global revenue and Asia-Pacific growing fastest at 14.03% CAGR (Mordor Intelligence).
Peer-reviewed research supports the trend: 52% of smartphone nutrition applications succeed in fostering healthier eating, according to a study published in Frontiers (cited by Mordor Intelligence). The combination of AI personalization and mobile accessibility is making meal planning a mainstream behavior rather than a niche practice.
AI transforms meal planning in three fundamental ways that traditional recipe apps and manual spreadsheets cannot replicate:
- Pantry-based personalization: AI builds plans from what you already have, rather than requiring you to shop for a specific recipe. This addresses the root cause of food waste — food that was bought but never used.
- Macro and dietary optimization: AI calculates precise portions to hit individual calorie and macro targets, adjusting across an entire week of meals rather than optimizing meal-by-meal. For detailed macro planning, see our macro meal planner guide.
- Constraint satisfaction: Allergies, dislikes, dietary restrictions, budget limits, cooking time limits, and ingredient availability are all constraints that AI handles simultaneously. A human planner typically manages 2–3 constraints before the task becomes overwhelming; AI handles dozens without effort.
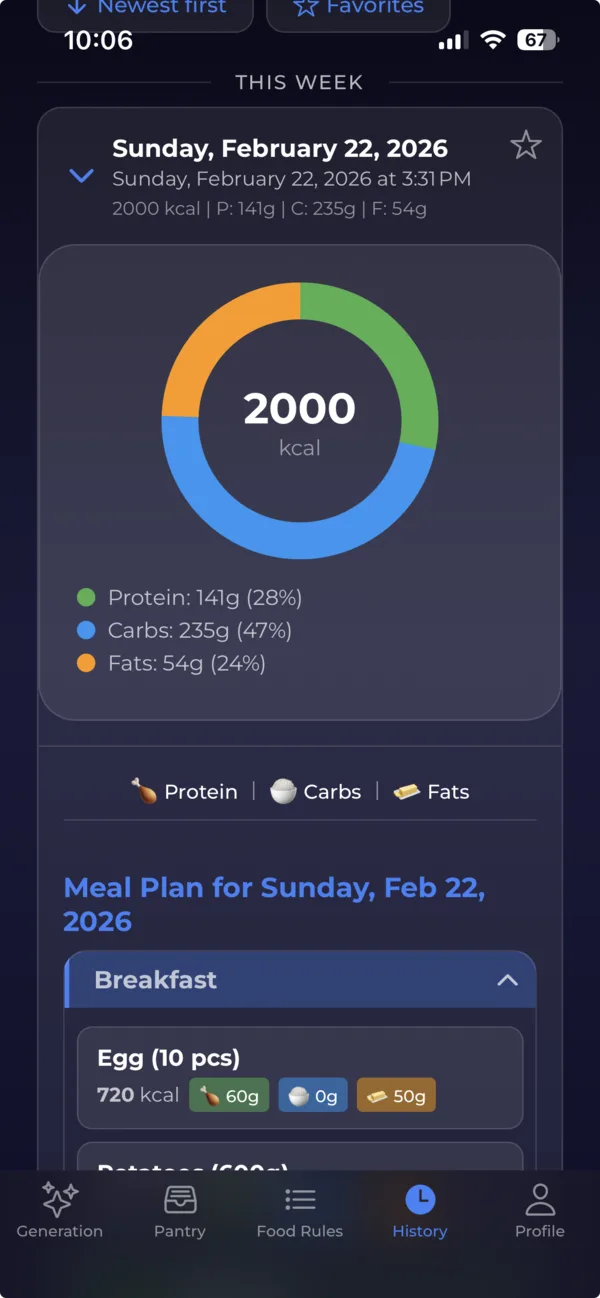
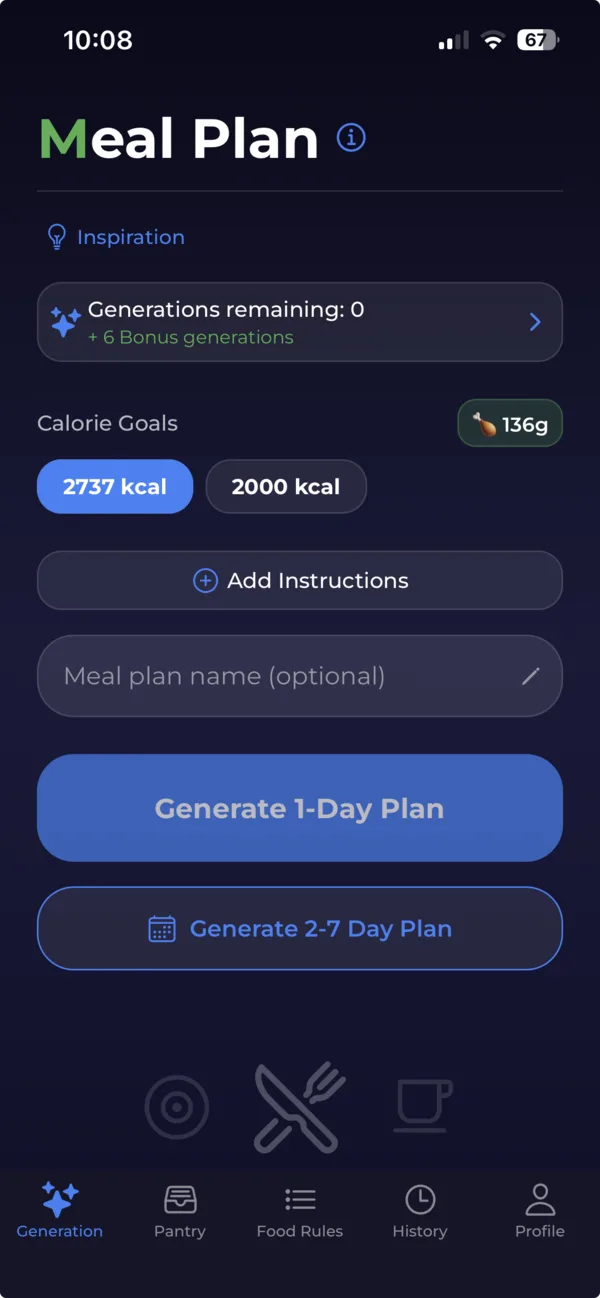
Qedamio is an example of this approach in practice: users inventory their pantry once, set their dietary preferences and macro targets, and the AI generates complete multi-day meal plans in seconds. The plan uses existing ingredients first, respects all food rules, and produces an aggregated shopping list for only the items that are missing. The entire planning process — from opening the app to having a complete week of meals — takes under two minutes.
The shift from manual to AI planning mirrors what happened in other personal productivity categories: navigation (paper maps to GPS), personal finance (spreadsheets to automated budgeting), and fitness (workout logs to adaptive training apps). In each case, AI removed the planning friction that prevented most people from being consistent. Meal planning is following the same trajectory. For a step-by-step approach to AI-assisted weekly planning, see our weekly meal planning guide. For meal prep optimization, see the meal prep planner guide.
See What AI Meal Planning Looks Like
Inventory your pantry, set your macro targets and food rules, and generate a complete meal plan in under 2 minutes. 7 free generations — no credit card, no trial clock.
Frequently Asked Questions
How much money does meal planning save per month?
The EPA estimates that reducing food waste could save a family of four $56 per month ($672/year). The average U.S. family of four spends nearly $3,000/year on food that goes uneaten (EPA). Additional savings come from fewer impulse purchases and fewer restaurant meals. Pantry-first AI meal planners maximize savings by building plans from ingredients you already have.
How much time does meal planning save per week?
BLS data shows Americans spend an average of 40 minutes/day on food prep (4.7 hours/week). Among those who actually cook, it is 7.4 hours/week. Meal planning eliminates the decision-making overhead — what to cook, what to buy, mid-week grocery runs. AI meal planners reduce the planning step itself to 1–2 minutes by generating complete plans from your pantry inventory.
What percentage of people meal plan?
About 57% of adults plan meals at least occasionally, according to a large-scale NutriNet-Santé study of over 40,000 participants (PMC, PMID: 28153017). Women are more likely to plan than men, and planning prevalence increases with age.
Does meal planning help with weight loss?
Yes. A study of 40,554 adults found that meal planners have better dietary quality and greater food variety. Women who plan meals are less likely to be overweight or obese. Digital meal planning platforms have also shown sustained weight loss results in obese users, according to research published in the Journal of Medical Internet Research. The mechanism is likely reduced reliance on convenience foods and takeout.
How much food do households waste each year?
In the U.S., 30–40% of the food supply goes uneaten (EPA). The average family of four spends nearly $3,000/year on food that is never eaten (EPA). Consumer food waste accounts for nearly 50% of all surplus food at a cost of $259 billion (ReFED). Over 80% of wasted food is perishable, with fruits and vegetables making up more than a third of all waste (ReFED).
Is cooking at home really cheaper than eating out?
Yes. BLS data shows the average household spent $6,224 on food at home (61.2%) versus $3,945 on food away from home (38.8%) in 2024. Fast food spending alone hit $1,727/year (up 17.3% from 2022). Shifting even a few restaurant meals per week to home-cooked delivers significant savings.
How big is the meal planning app market?
The diet and nutrition apps market (which includes meal planners) is valued at $5.76 billion in 2025 and projected to reach $10.15 billion by 2030 at an 11.97% CAGR (Mordor Intelligence). AI-powered meal planning features are the fastest-growing segment, expanding at 13.89% CAGR. North America captures 32.78% of global revenue.
How does AI improve meal planning?
AI transforms meal planning by personalizing plans to individual pantry inventories, macro targets, dietary restrictions, and food preferences. Instead of browsing recipes manually, AI generates complete plans in seconds. Research shows 52% of smartphone nutrition apps succeed in fostering healthier eating (Frontiers, cited by Mordor Intelligence). AI planners like Qedamio build plans from food you already have, reducing waste and eliminating the decision fatigue of choosing 21 meals per week.
Conclusion: The Data Points to Planned Meals
The meal planning statistics for 2026 converge on a single conclusion: planning meals is one of the highest-return habits a household can adopt. U.S. families waste nearly $3,000/year on uneaten food (EPA), Americans spend 4.7+ hours/week on food prep (BLS), and a 40,554-person study links meal planning to better diet quality and lower obesity risk (PMC). The data is consistent across government agencies and peer-reviewed research.
The diet and nutrition apps market’s growth from $5.76 billion to a projected $10.15 billion by 2030 reflects this reality (Mordor Intelligence). AI-powered meal planning features are growing faster than the overall market at 13.89% CAGR, because they solve the core problem: the planning itself is too time-consuming. When AI compresses 60–90 minutes of weekly planning into 60 seconds, the adoption barrier disappears.
The next five years will likely see AI meal planning become as routine as GPS navigation or automated budgeting — tools that were once manual, tedious tasks are now expected to be handled by software. For a practical starting point, see our food waste statistics for the environmental case, or try calorie deficit meal planning for goal-specific plans.
Methodology & Sources
All statistics cited in this article are drawn from the following categories of sources. We link to primary sources wherever available and note when figures represent estimates or projections.
Government Agencies
- EPA — Preventing Wasted Food at Home — Family food waste cost ($3,000/year), monthly savings ($56), waste disposal (96%)
- EPA — U.S. 2030 Food Loss and Waste Reduction Goal — 30–40% food supply wasted, food waste as #1 landfill material, 85% GHG from pre-disposal, per-person waste trends (328–349 lbs)
- EPA — Food: Material-Specific Data — 66 million tons wasted food (2019), 60% to landfill
- BLS — Consumer Expenditure Survey 2024 — Food spending ($10,169/year), home vs. away split (61.2% / 38.8%)
- BLS — Consumer Expenditure Report 2023 — Fast food ($1,727/year), full-service restaurants ($1,485/year), historical food spending trends
- BLS — American Time Use Survey 2024 — Food prep time (0.67 hrs/day avg, 1.06 hrs among cooks), 63.1% cook on any given day
Peer-Reviewed Research
- Ducrot P, et al. “Meal planning is associated with food variety, diet quality and body weight status in a large sample of French adults.” Int J Behav Nutr Phys Act. 2017;14(1):12. (PMID: 28153017, n=40,554)
Food Waste Research
- ReFED — The Problem — $381B surplus food, $325B waste, 1.3% of GDP, 114B meals wasted, 80%+ from perishables
- ReFED — Consumer Food Waste — $760/person/year, 50% of surplus from consumers ($259B), three-quarters perception gap
- ReFED — The Solutions — Prevention-focused strategies, consumer perception data
- Eurostat — Food Waste Estimates (2023) — EU: 58M tonnes total, 31M from households (53%), 130 kg/person
Industry & Market Research
- Mordor Intelligence — Diet & Nutrition Apps Market — $5.76B (2025) to $10.15B (2030), 11.97% CAGR, AI meal planning at 13.89% CAGR
- IFIC — 2023 Food & Health Survey — 91% saw food price increases, 76% cite price in decisions, 74% link food to well-being
- Escoffier — 20% of meals eaten out, 26% for Gen Z
← Back to AI Meal Planner · Related: Weekly Meal Planning Guide · Meal Prep Planner · Cheap Meal Planner · Reduce Food Waste · Pantry Meal Planner · Macro Meal Planner
Disclaimer: This article compiles publicly available statistics from government agencies, peer-reviewed studies, and industry research reports. Market projections are estimates from the cited research firms and may differ from actual future outcomes. Individual savings from meal planning will vary based on household size, location, dietary patterns, and current spending habits. This article is for informational purposes and does not constitute financial, nutritional, or medical advice.